Setup
The test focused on consumer motivations in adopting e-scooter services. To that end, the two assets were designed to test performance across the following A/B split:
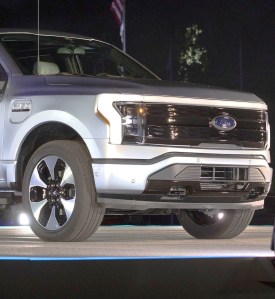
- AMessaging focused on reducing traffic
- BMessaging focused on reducing pollution
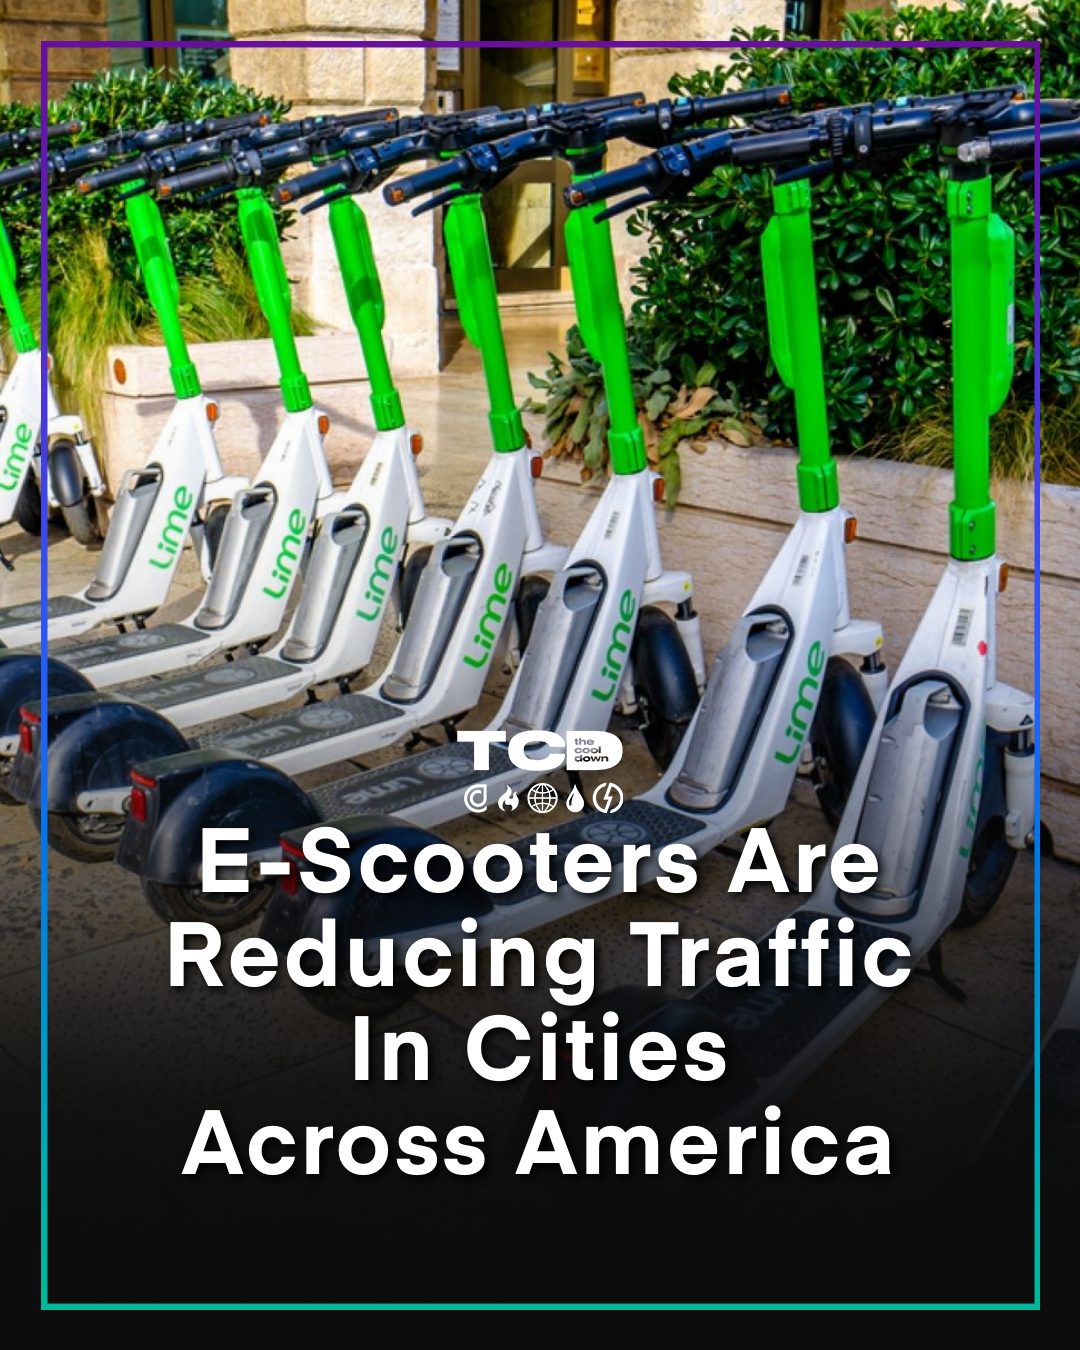 A
A
 B
B
Test Results
Attention Share and Engagement Share reflect the percentage of test-wide scoring accounted for by individual variants or demographics. Read more below in the Methodology section.
Aggregate Insights
Messaging around reducing traffic produced more attention at the top of the funnel and more engagement deeper down the funnel.
The relatively narrow gap between engagement shares for the two assets suggests that a message marrying both value props — i.e., a message speaking to traffic reduction and pollution reduction simultaneously — may outperform an either/or approach.
Further testing could examine attention and engagement shares of messages about different micromobility solutions — e.g., e-scooters vs. e-bikes — to determine which mode of transit resonates most strongly with consumers.
Gender-based attention and engagement shares reflect the relative attention or engagement per gender for each variant. Read more below in the Methodology section.
Gender Insights
The test population skewed toward male participants, who demonstrated a preference for "reducing traffic" across attention and engagement metrics.
With a smaller sample size, female participants demonstrated a preference for "reducing pollution" across attention and engagement metrics but generally paid less attention to both variants than male participants.
Further testing could target the female audience with a message marrying both value props in an attempt to break through the attention wall and unlock the engagement potential suggested by this sample.
Age-based attention and engagement shares reflect the relative attention or engagement per age bracket for each variant. Read more below in the Methodology section.
Age Insights
The attention and engagement advantage of the "reducing traffic" message was concentrated among participants between the ages of 25 and 54.
Participants aged 55+ demonstrated an attention and engagement preference for the "reducing pollution" message, with participants over the age of 65 paying more attention to and engaging more readily with both variants overall relative to other age cohorts.
Further testing could target participants under the age of 25 — who are less likely to own cars — to compile a more robust data set and determine whether the lack of interest suggested by these results is merely a symptom of small sample size.
Methodology
This test was conducted with two message variants and a prequalified TCD audience of 4,591 likely adopters. Among those participants, 6.2% paid measurable attention to the test assets, and 3.4% registered measurable engagement.
Attention Score measures the likelihood that a message will capture eyeballs in the wild. It’s calculated using the rate at which test participants respond to a CTA to learn more about the subject.
Engagement Score measures the likelihood that a message will elicit a meaningful response from the audience. It’s calculated using a proprietary algorithm that weights measurable metrics — shares, saves, likes, etc. — in a way that has proven to be meaningfully correlated (r > .5) to real-world conversion behavior.
Attention Share and Engagement Share reflect the percentage of test-wide scoring accounted for by individual variants or demographics. For example, an engagement share of 25% means the variant or demographic in question accounted for 25% of the cumulative engagement score produced by all segments in the test.